
Black Migration to the U.S. (1/2). 2025. Screenprint and chine collé 22 x 28 in. Edition of 20. Printed and published by Graphicstudio, University of South Florida, Tampa, FL. @Villalongo Studio LLC. Courtesy William Villalongo, Shraddha Ramani and USF Graphicstudio, Tampa, FL.
BLACK MIGRATION TO THE U.S. 1/2 | We reimagine Du Bois’s iconic image of the eastern and western hemispheres of the globe, that trace the paths of the trans-Atlantic slave trade over two images. This is where Du Bois’s famous remarks, “The problem of the 20th Century is the problem of the color-line” would first appear well before his most well known work “The Souls of Black Folk” would be written. In 1 of 2, current Black migration is represented by the black circle & arrow icons in addition to the forced migration from the African continent in red that Du Bois rendered as an image of what diaspora looked like in 1900. We use of the Fuller Map Projection created by Buckminster Fuller. The Fuller Projection shows the size of landmasses in correct portion. By design the Fuller map can be folded into a tetrahedron globe in its flat state the map suggest the interconnectedness and interaction between continents.
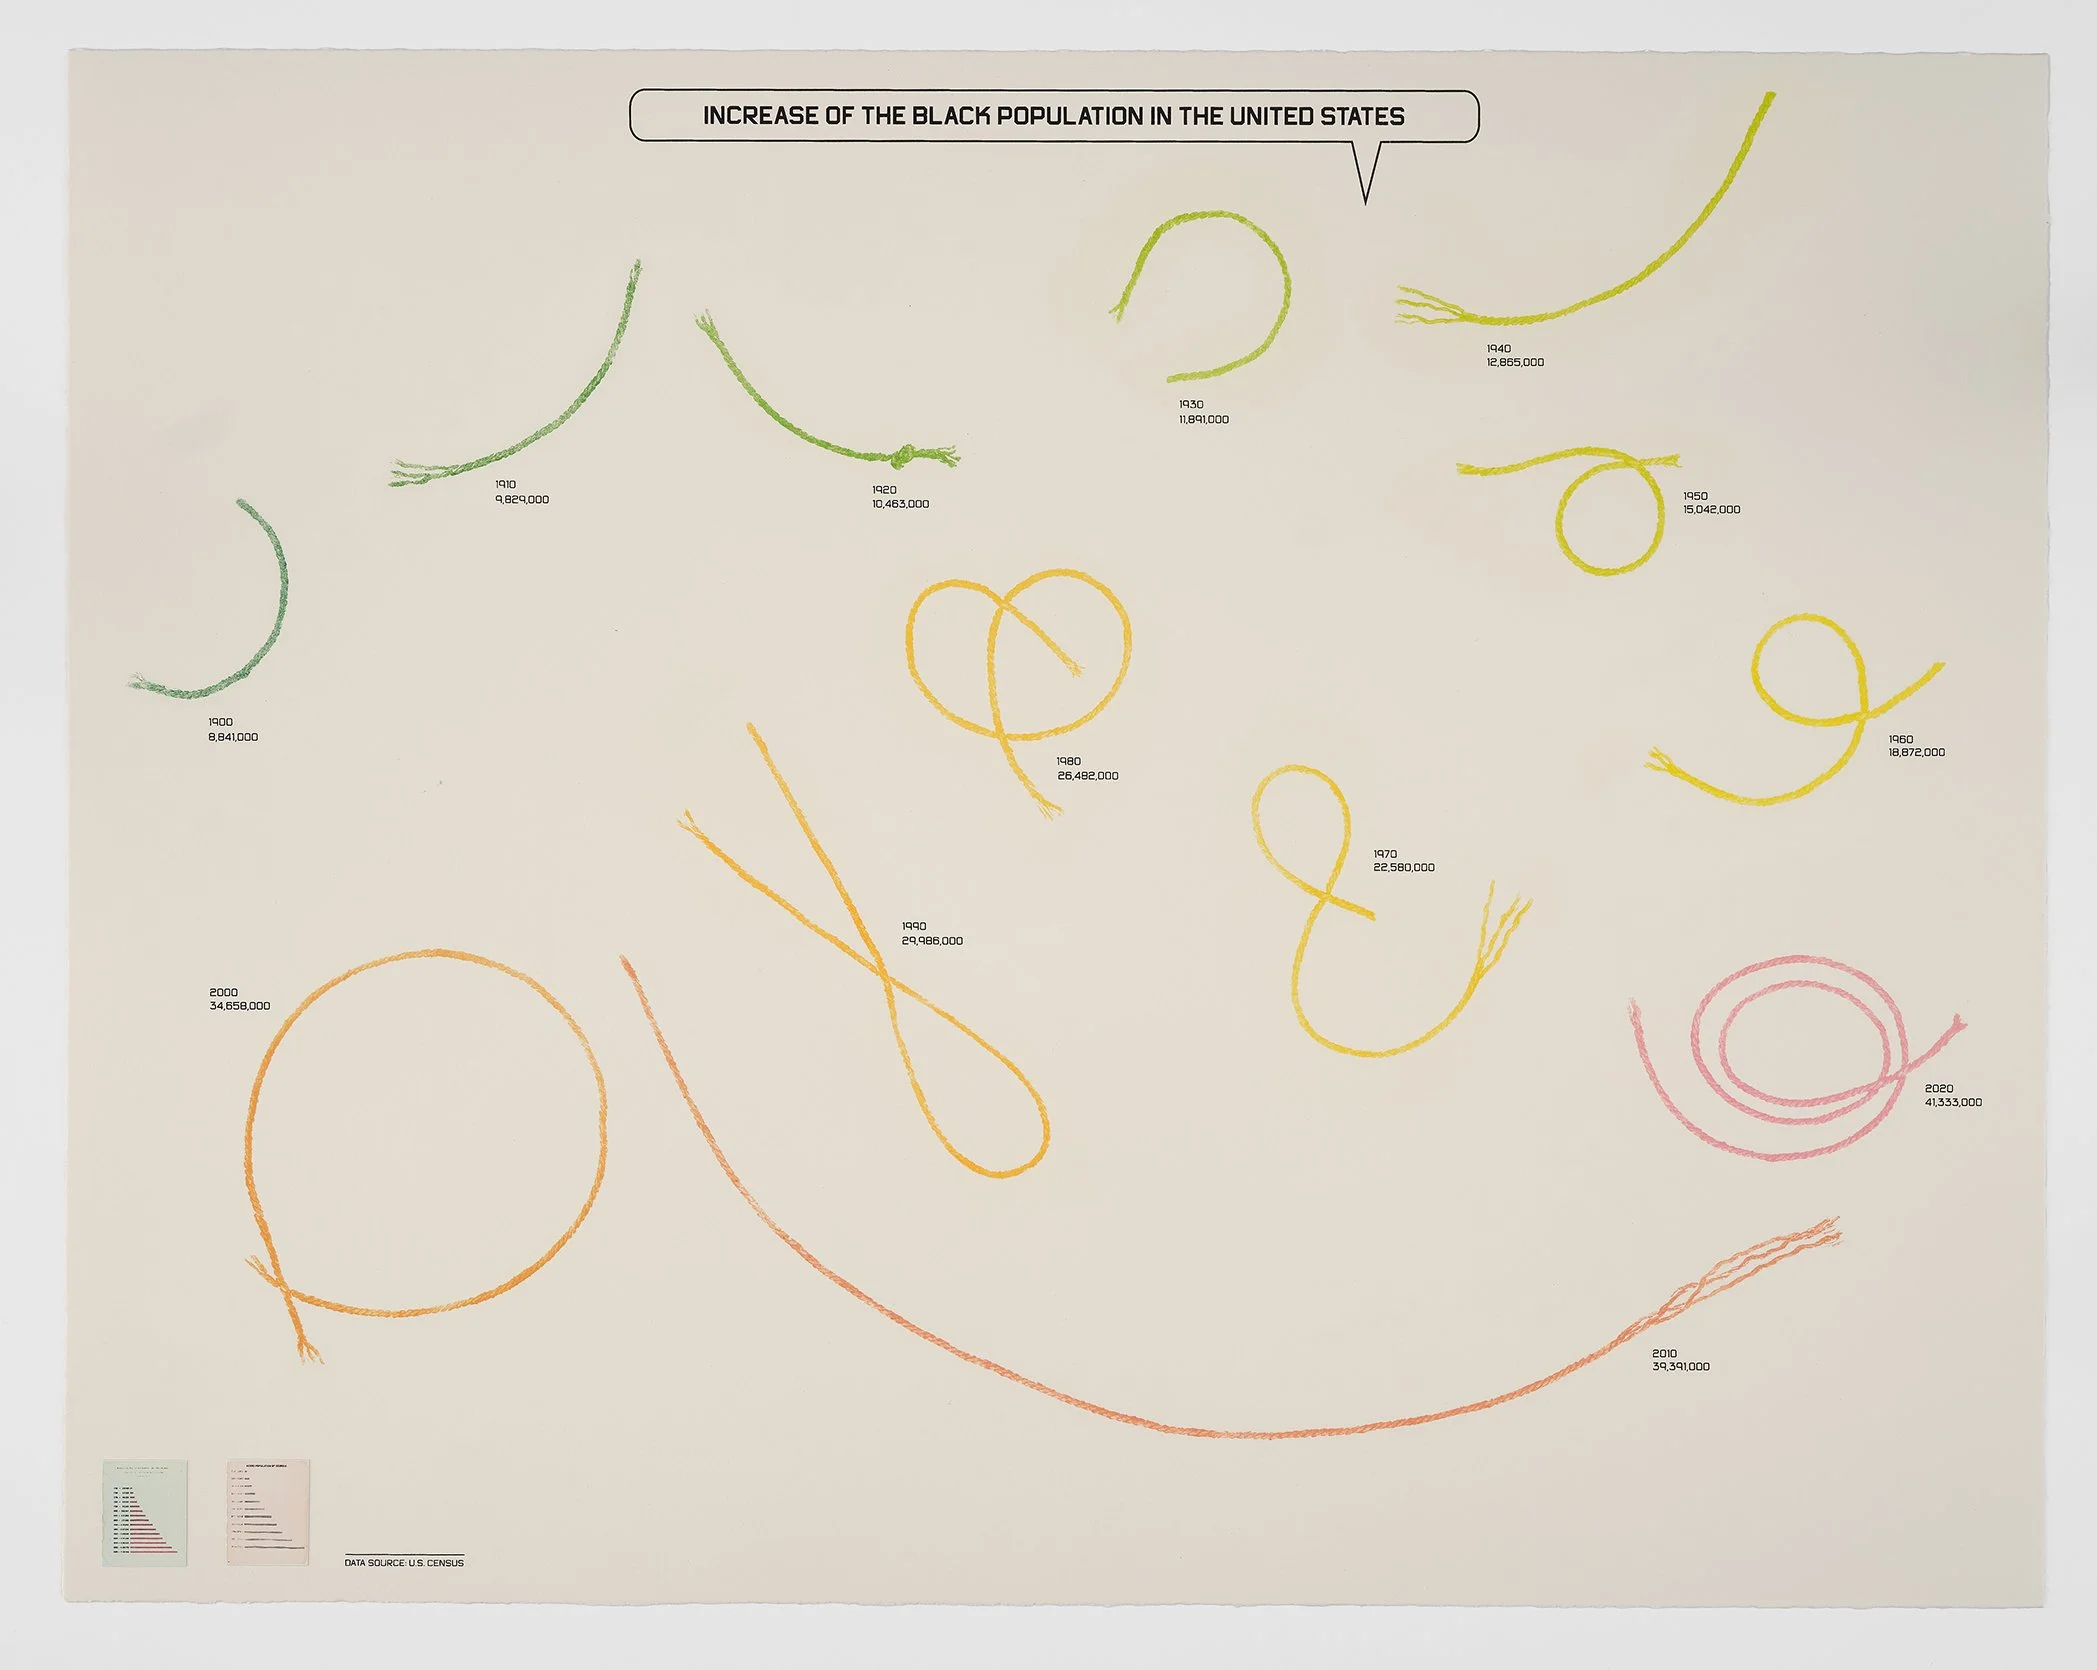
Increase of the Black Population in the United States. 2025. Photogravure, screenprint, and chine collé 22 x 28 in. Edition of 20. Printed and published by Graphicstudio, University of South Florida, Tampa, FL. @Villalongo Studio LLC. Courtesy William Villalongo, Shraddha Ramani and USF Graphicstudio, Tampa, FL.
INCREASE OF THE BLACK POPULATION IN THE UNITED STATES | Starting from a simple bar chart, this visualization holds a lot of whimsy yet it is also undergirded with darkness. We use tiny pieces of rope that have been inked and pressed into the paper in place of the straight bars. Each length of rope is 1:1 with the bar chart lengths, however we have used the flexible properties of rope to twist and loop each length asking the viewer to unwind them visually. We consider the multitude of Black life in the wake of chattel slavery and their painful legacies in the 21st century while celebrating the diversity and dignity of Black life. When Du Bois exhibited his “data portraits” in the Negro Exhibition in 1900 most of the Western world thought that without slavery Black people in the U.S. would die out in a generation after Emancipation.

Black Homeowners in the States & Territories of the U.S. 2025. Screenprint and chine collé 28 x 22 in. Edition of 20. Printed and published by Graphicstudio, University of South Florida, Tampa, FL. @Villalongo Studio LLC. Courtesy William Villalongo, Shraddha Ramani and USF Graphicstudio, Tampa, FL.
BLACK HOMEOWNERS IN THE STATES & TERRITORIES OF THE U.S. This visualization started as a simple bar chart and as we shaped it in the round the bars became rays emanating from the center like a comic book punch! So we pulled in the Black Power fist to activate it. The story of Black homeownership in the U.S. is not a wholly positive story. However, to the extent that we place todays numbers in relationship to a larger history there are some rays of light in interesting places as the data show. We see that Black homeownership is much higher in the former slave holding states of the American South. It is particularly, high in Puerto Rico. These data bring up questions critical to current discussions around statehood for Puerto Rico, the shifting Black demographics in U.S. cities and states while exposing existing challenges which continue to put homeownership out of reach. We highlight the 5 states where Black homeownership is over 50%.

Black Migration to the U.S. (2/2). 2025. Screenprint, direct gravure, and chine collé 22 x 28 in. Edition of 20. Printed and published by Graphicstudio, University of South Florida, Tampa, FL. @Villalongo Studio LLC. Courtesy William Villalongo, Shraddha Ramani and USF Graphicstudio, Tampa, FL.
BLACK MIGRATION TO THE U.S. 2/2 | In part two we are showing forced Black migration in America in relation to other Black migration. The blue circles show the increase of the enslaved population in America from 1619 to 1865 and the Black circles represent the increase in other Black migration to the U.S. which we find data for as early as 1850 and we track into 2020. The timeline creates a loop starting at top with 1619 and looping under and back ending at 2020. The loop is significant for us. The data shows a few things firstly that at the height of the slave trade Black people were coming to the U.S. voluntarily for any number of reasons. The other is the complexities of what Black diaspora is within the American context. When we talk about Black America in the 21st Century it is light years away from the picture Du Bois had in front of him, yet the legacies of slavery in America touch all Black lives through the systemic ways it flattens and undermines our lived experiences.

Employment by Race, Highlighting Innovative Industries. 2025. Spitbite, screenprint, lithography, and chine collé 22 x 28 in. Edition of 20. Printed and published by Graphicstudio, University of South Florida, Tampa, FL. @Villalongo Studio LLC. Courtesy William Villalongo, Shraddha Ramani and USF Graphicstudio, Tampa, FL.
EMPLOYMENT BY RACE AND INDUSTRY, HIGHLIGHTING INNOVATIVE INDUSTRIES | What appears to be a colorful abstract painting is really a bar chart. There are 5 major vertical bars that correspond to racial categories from left to right. Each bar is segmented with colors that represent an industry. Within these segments of industry we highlight the proportion of that industry that represents “innovative industries” with a clear gloss overlay. Some colors are silkscreen and some are impressions of wood block or spit bite etching that are cut to form and collaged to achieve the seamless butting of colors and bars. We also took license to reshape the square segments to push the form further from a simple bar chart. The term “Advanced Industries” is taken from a Brookings Institute study published in 2015, “America’s Advanced Industries: What Are They?, Where Are They? and Why Do They Matter?” At the time Du Bois made his data portraits there were few major industries being tracked by the U.S. Census than are today and of those Black people found themselves employed in about 6. There are now hundreds of industries for which Black employment is significant. Given that level of granularity we consolidate these down to 9 for the sake of being legible. Additional considerations is the diversity of the of the country itself. To see a relative picture of Black employment one needs to consider how other race categories compare. Lastly, we incorporate “advanced industries” which account for 21st Century jobs that did not exist for Du Bois. We recognize that Black people account in these tech forward jobs, even while we may see low numbers as result of further systemic issues. Brookings defines these “advanced industries” as having both “a high number of workers in STEM professions and high levels of R&D spending”