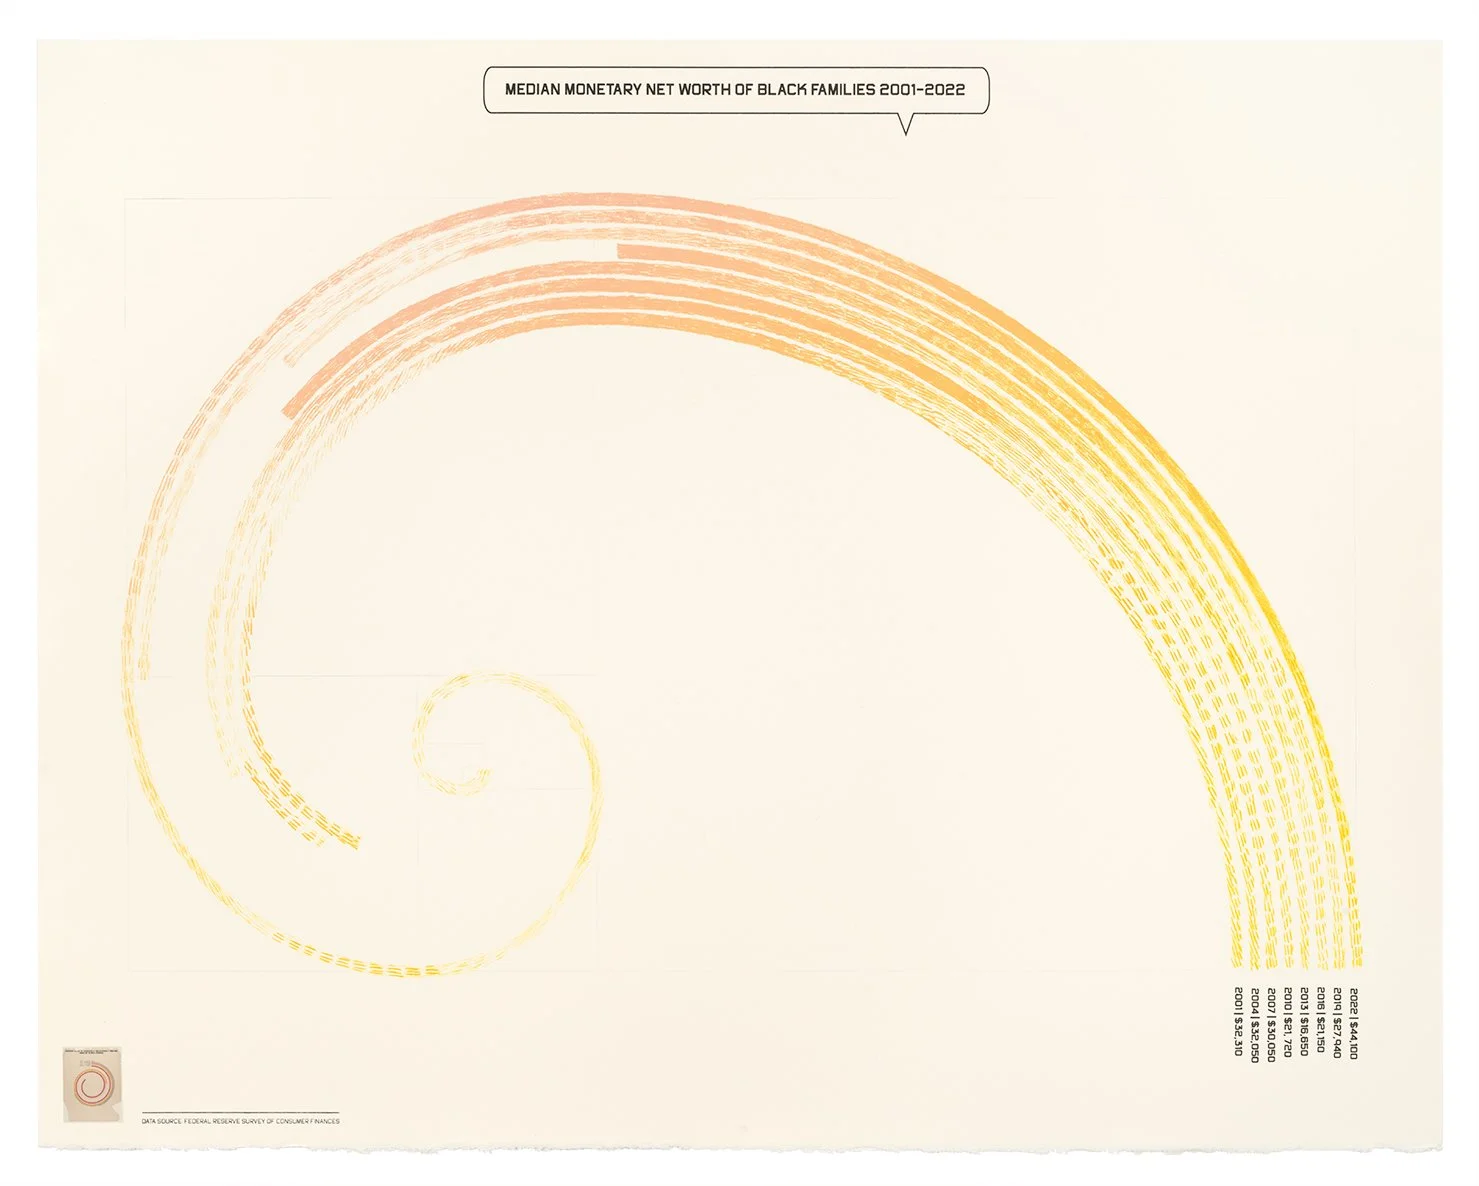
Median Net Monetary Worth of Black Families 2001–2022. 2025. Lithograph and chine collé 22 x 28 in. Edition of 20. Printed and published by Highpoint Center for Printmaking, Minneapolis, MN ©Villalongo Studio LLC. Courtesy William Villalongo, Shraddha Ramani and Highpoint Center for Printmaking, Minneapolis, MN
MEDIAN NET MONETARY WORTH OF BLACK FAMILIES 2001-2002 | In 1900 there was no data being taken on the financial status of Black families. Du Bois made a sample from a range of towns in Georgia issuing paper surveys door to door to collect this data. As well, the notion of Black generational wealth would not have been possible. Now we can, in some part thanks to the generation Du Bois focused on. At that time Du Bois measured Black wealth by objects of value such as “household and kitchen furniture” as his original is titled. These are objects that would have been significant purchases, well cared for and passed down to younger generations. Today, Black wealth lives within the normative definitions we think of such as savings, investments, equity and assets. We update the original using a national survey conducted by the Federal Reserve. We reimagine Du Bois’s dynamic spiral in the form of a “Golden Ratio” diagram. The Golden Ration is a mathematical ratio found in various natural structures and patterns. What is revealed by our update is the precarious nature of Black wealth as we see it retract in step with recent economic recessions.

Mortgage Interest Rates of Black and White Homeowners. 2025. Lithograph and chine collé 22 x 28 in. Edition of 20. Printed and published by Highpoint Center for Printmaking, Minneapolis, MN ©Villalongo Studio LLC. Courtesy William Villalongo, Shraddha Ramani and Highpoint Center for Printmaking, Minneapolis, MN
MORTGAGE INTEREST RATES OF BLACK AND WHITE HOMEOWNERS | In our project we see that Black families are increasingly moving out of cities and moving to the burbs. Many are chasing the American Dream of homeownership and more space for their children to play and grow. In many towns in the U.S. historical redlining put a significant barrier to this dream for most Black families. Jim Crow era covenant laws, zoning laws and infrastructure development have all played a part in this. While Black families still struggle through the sometimes obscure hangovers of the past there are clear signs. As we parse this question around challenges to homeownership we see the disparities present within mortgage interest rates. What we find is that on average Black families are paying higher interest rates in order to have the same dream as white families. While the percentage of Black families that outright own their homes is less than than that of white families, the disparity is not extreme. However, the ceiling for white families with mortgages is 7% with the majority paying under 4%. Black families pay rates as high as 8% with nearly half of those with mortgages paying over 4%. The picket fence dissipates to white as the hurdles to the dream get higher. We bring back the specter of the red line to imply historical challenges anew.

Characteristics of Black and African American Farmers in Minnesota. 2025. Lithograph 22 x 28 in. Edition of 20. Printed and published by Highpoint Center for Printmaking, Minneapolis, MN ©Villalongo Studio LLC. Courtesy William Villalongo, Shraddha Ramani and Highpoint Center for Printmaking, Minneapolis, MN
CHARACTERISTICS OF BLACK AND AFRICAN AMERICAN FARMERS IN MINNESOTA | The story of Black farming in the U.S. is one of dramatic decline. Consecutive decades of disenfranchisement from deed theft to being denied subsidies and loans offered to white farmers have pushed Black farming to the margins. When Du Bois made his original “data portraits” Black farming and farm industry work accounted for the largest portion of occupations and land ownership for Black families. The 1990 Farm Bill attempted to address this historical discrimination by including grants and other resources for “minority farmers”. In 2022 the Biden Administration authorized $2 billion in payments to Black farmers intended to address historical discrimination by USDA lending programs. This came as an answer to still unresolved issues in the Pigman v. Glickman settlement, a class action lawsuit against the USDA by Black farmers which was first settled in 1999. These efforts made an impact on some Black farmers, but were poorly implemented leaving many farmers with denied claims and navigating a difficult administrative process.
Our conversations with local artist and activist Whitney Terrill explored her activism and advocacy for Black and minority farmers and her own experience with being a farmer. This led to considering the various characteristics of Black farmers in the state to get some sense of where they are and what they produce. The image is a typology of Du Bois’s original graphs used to present information on other topics. The vivid color and geometric work of Du Bois is captured and appropriated to make visible what Black farming in Minnesota looks like.

Debt-to-Asset Ratio of U.S. Families by Race & Ethnicity. 2025. Relief, lithograph, and chine collé 22 x 28 in. Edition of 20. Printed and published by Highpoint Center for Printmaking, Minneapolis, MN ©Villalongo Studio LLC. Courtesy William Villalongo, Shraddha Ramani and Highpoint Center for Printmaking, Minneapolis, MN
DEBT-TO-ASSET RATIO OF U.S. FAMILIES BY RACE & ETHNICITY | When considering Du Bois original data portrait “Value of Land Owned by Georgia Negroes” we came to realize that land ownership was the highest value asset and possibly the only asset of real value for some families. We parse this question for the 21st Century within a U.S. economic system that is radically different and for which Black families participate dynamically. We conclude that debt may be the most significant factor in any economic portrait and is particularly important when looking at Black families today where credit and credit worthiness maybe more consequential than actual funds. Our visualization shows how far “underwater” U.S. families are and what they have to buoy them particularly in difficult economic times for all. In the image we see the money bags in Du Bois’s original afloat at sea each accounting for the total assets of families and the water line demarks the severity of debt. The use of wood block relief evokes the turbulent seas of Hokusai’s “The Great Wave of Kanagawa”.

Black Owned Business in the Twin Cities. 2025. Lithograph, screenprint, and chine collé. 22 x 28 in. Edition of 20. Printed and published by Highpoint Center for Printmaking, Minneapolis, MN ©Villalongo Studio LLC. Courtesy William Villalongo, Shraddha Ramani and Highpoint Center for Printmaking, Minneapolis, MN
BLACK OWNED BUSINESS IN THE TWIN CITIES | The infographic is an update Du Bois’s original “Negro Business Men in the U.S.” by way of an activist project in the Twin Cities. The MSP BIPOC Business Map is a website and open source map allowing users to find minority owned businesses in the Twin Cities created by Atharv Kulkarni in 2023. Users can add to the map and Kulkarni has paired this with social media presence on LinkedIn, Instagram and TikTok. The highly successful approach creates a significant sample of BIPOC Businesses that is constantly being updated. Kulkarni started his project as a way to invigorate local BIPOC solidarity initiated by the Black Lives Matter protests in the wake of George Floyd’s murder by the police in Minneapolis in 2020. The image expresses a flourishing of Black businesses in the Twin Cities as it heals from these still resonate events. Villalongo uses his iconic floral motifs to illuminate businesses against MSP geography. Where and what the businesses are reflect the needs and industriousness of its communities. Conversely, where Black owned businesses are not located exposes difficult truths between the hope of Black entrepreneurship and historically underserved Black communities.