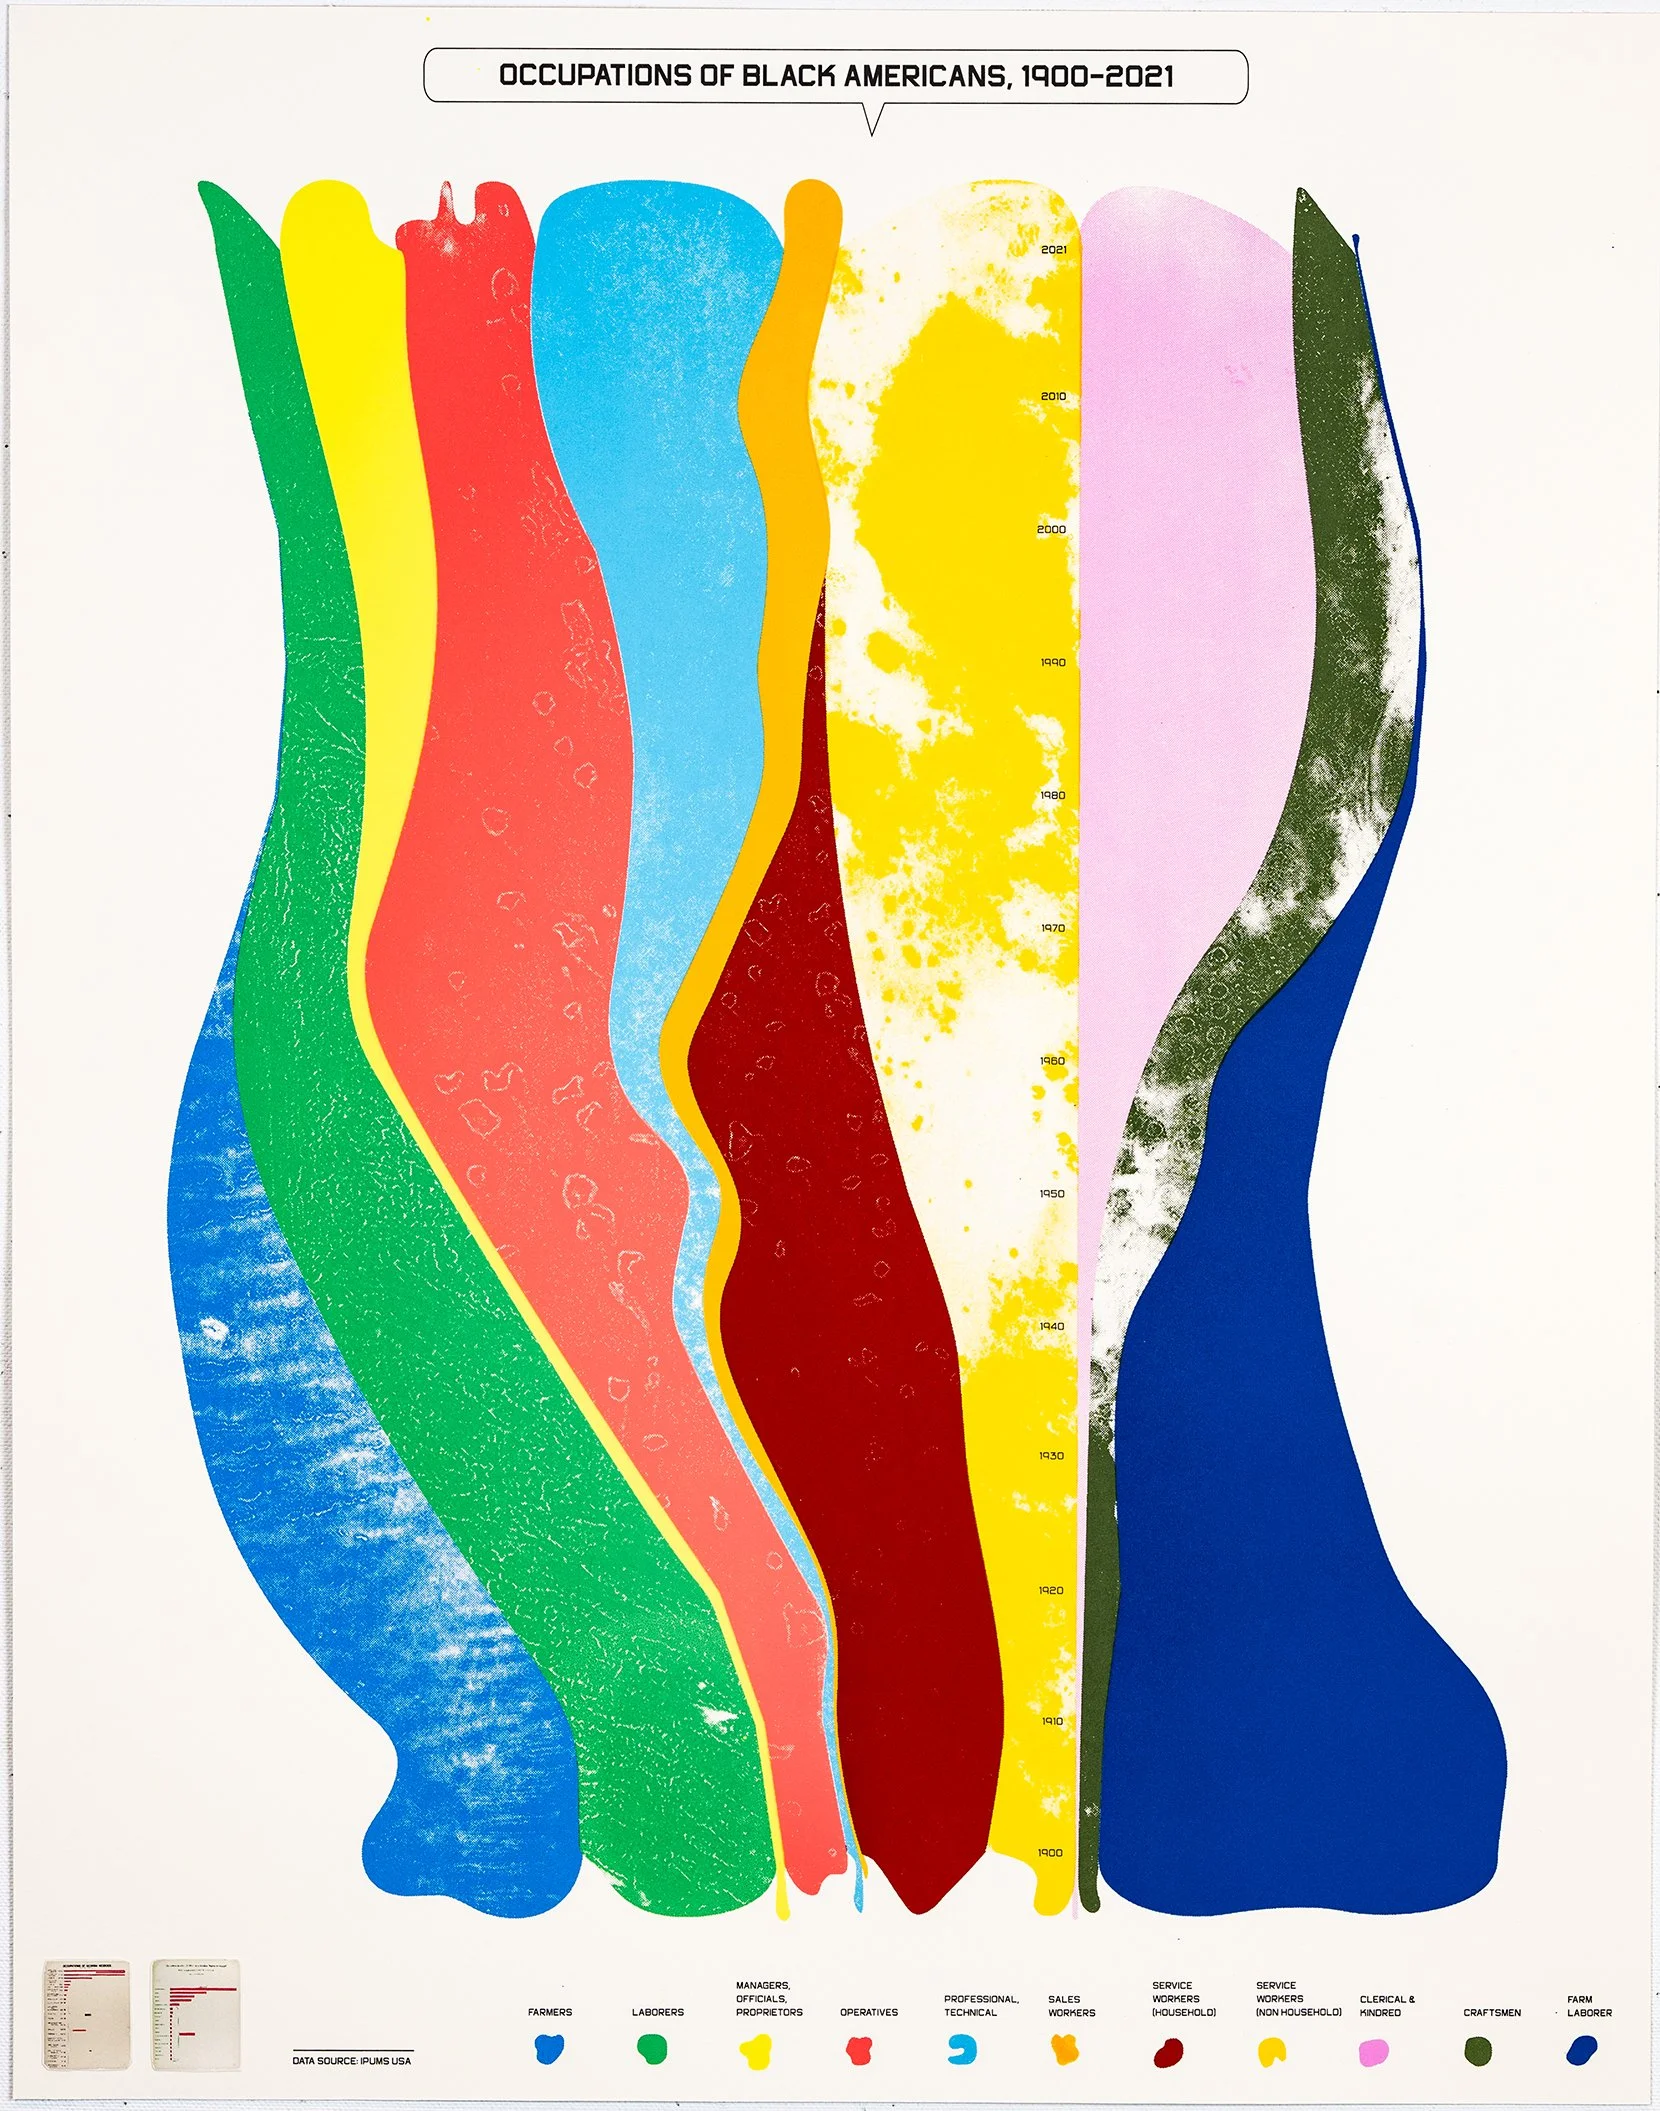
Occupations of Black Americans 1900 - 2021. Screenprint, chine collé. 28 x 22 in. Printed and published by Island Press, Washington University, St. Louis, MO ©Villalongo Studio LLC. Courtesy William Villalongo, Shraddha Ramani and Island Press, St Louis, MO.
OCCUPATIONS OF BLACK AMERICANS, 1900-2021 | The image shows the changing face of Black participation in various occupations since Du Bois’s original work in 1900 until today. The timeline runs from 1900 at the bottom to 2021 at the top. The colorful plumes fluctuate between thick and then as Black participation in each of the eleven categories shifts. This image updates two original Du Bois data portraits which show occupation categories and Black participation nationally and in the state of Georgia.The image is a simple bar chart that has been manipulated to smooth out the jagged zig-zag of straight lines into curves suggesting colorful flows through time.
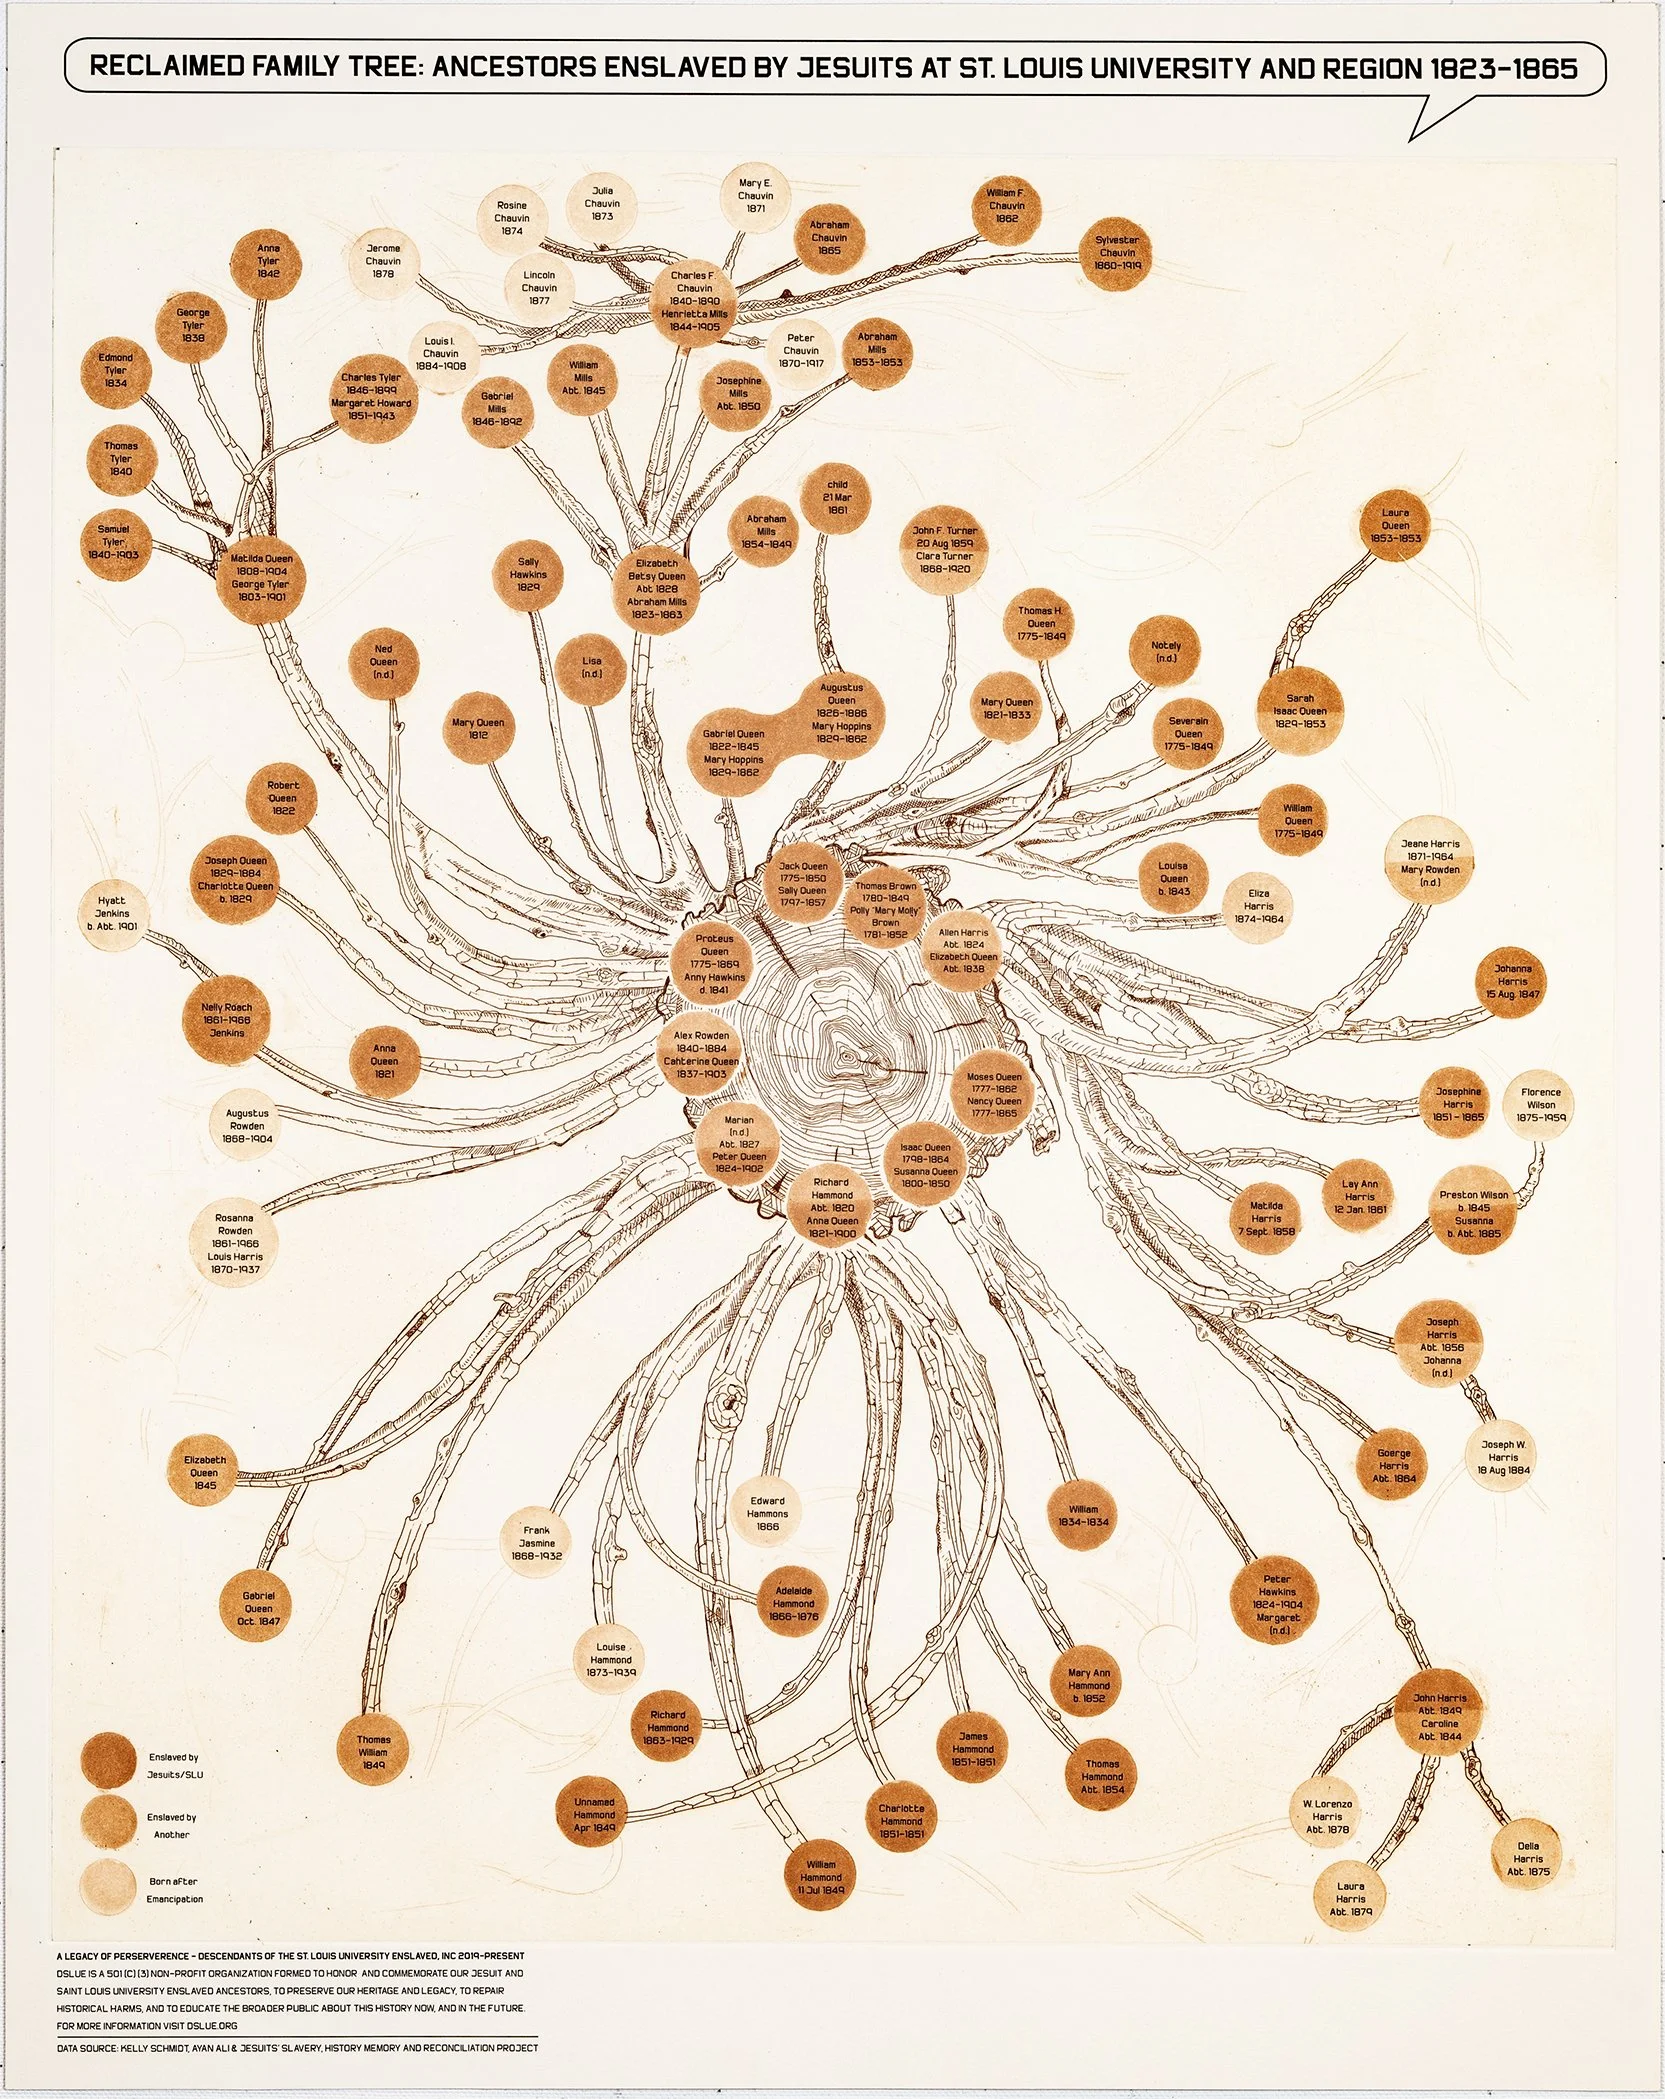
Reclaimed Family Tree: Ancestors Enslaved by Jesuits at St. Louis University and Region 1823-1865. Etching, aquatint, chine collé. 28 x 22 in. Printed and published by Island Press, Washington University, St. Louis, MO ©Villalongo Studio LLC. Courtesy William Villalongo, Shraddha Ramani and Island Press, St. Louis, MO.
RECLAIMED FAMILY TREE: ANCESTORS ENSLAVED BY JESUITS AT ST. LOUIS UNIVERSITY AND REGION 1823-1865 | In 2019, Robin Proudie and members of her family were contacted by researchers from the Slavery, History, Memory, and Reconciliation Project (SHMR)—a joint initiative between Saint Louis University and the Society of Jesus—to study their ties to slavery. The research revealed that SLU enslaved upwards of 70 people between 1823 -1865, many of whom were Robin's ancestors. In response, Robin led other descendants, and a group of allies to form Descendants of the St. Louis University Enslaved, or DSLUE, an organization centered around Remembrance, Restoration, and Repair. Through the SHMR project Robin was able to make a simple family tree going back roughly 4 generations under the categories “Enslaved by the Jesuits/SLU”, “Enslaved by Another” and “After Emancipation”. We portray her reclaimed family tree as a cross section of a literal tree as viewed from above. The trunk holds the original enslaved people from Maryland, sold to the Jesuits at SLU. The branches spur out and around with each consecutive generation.
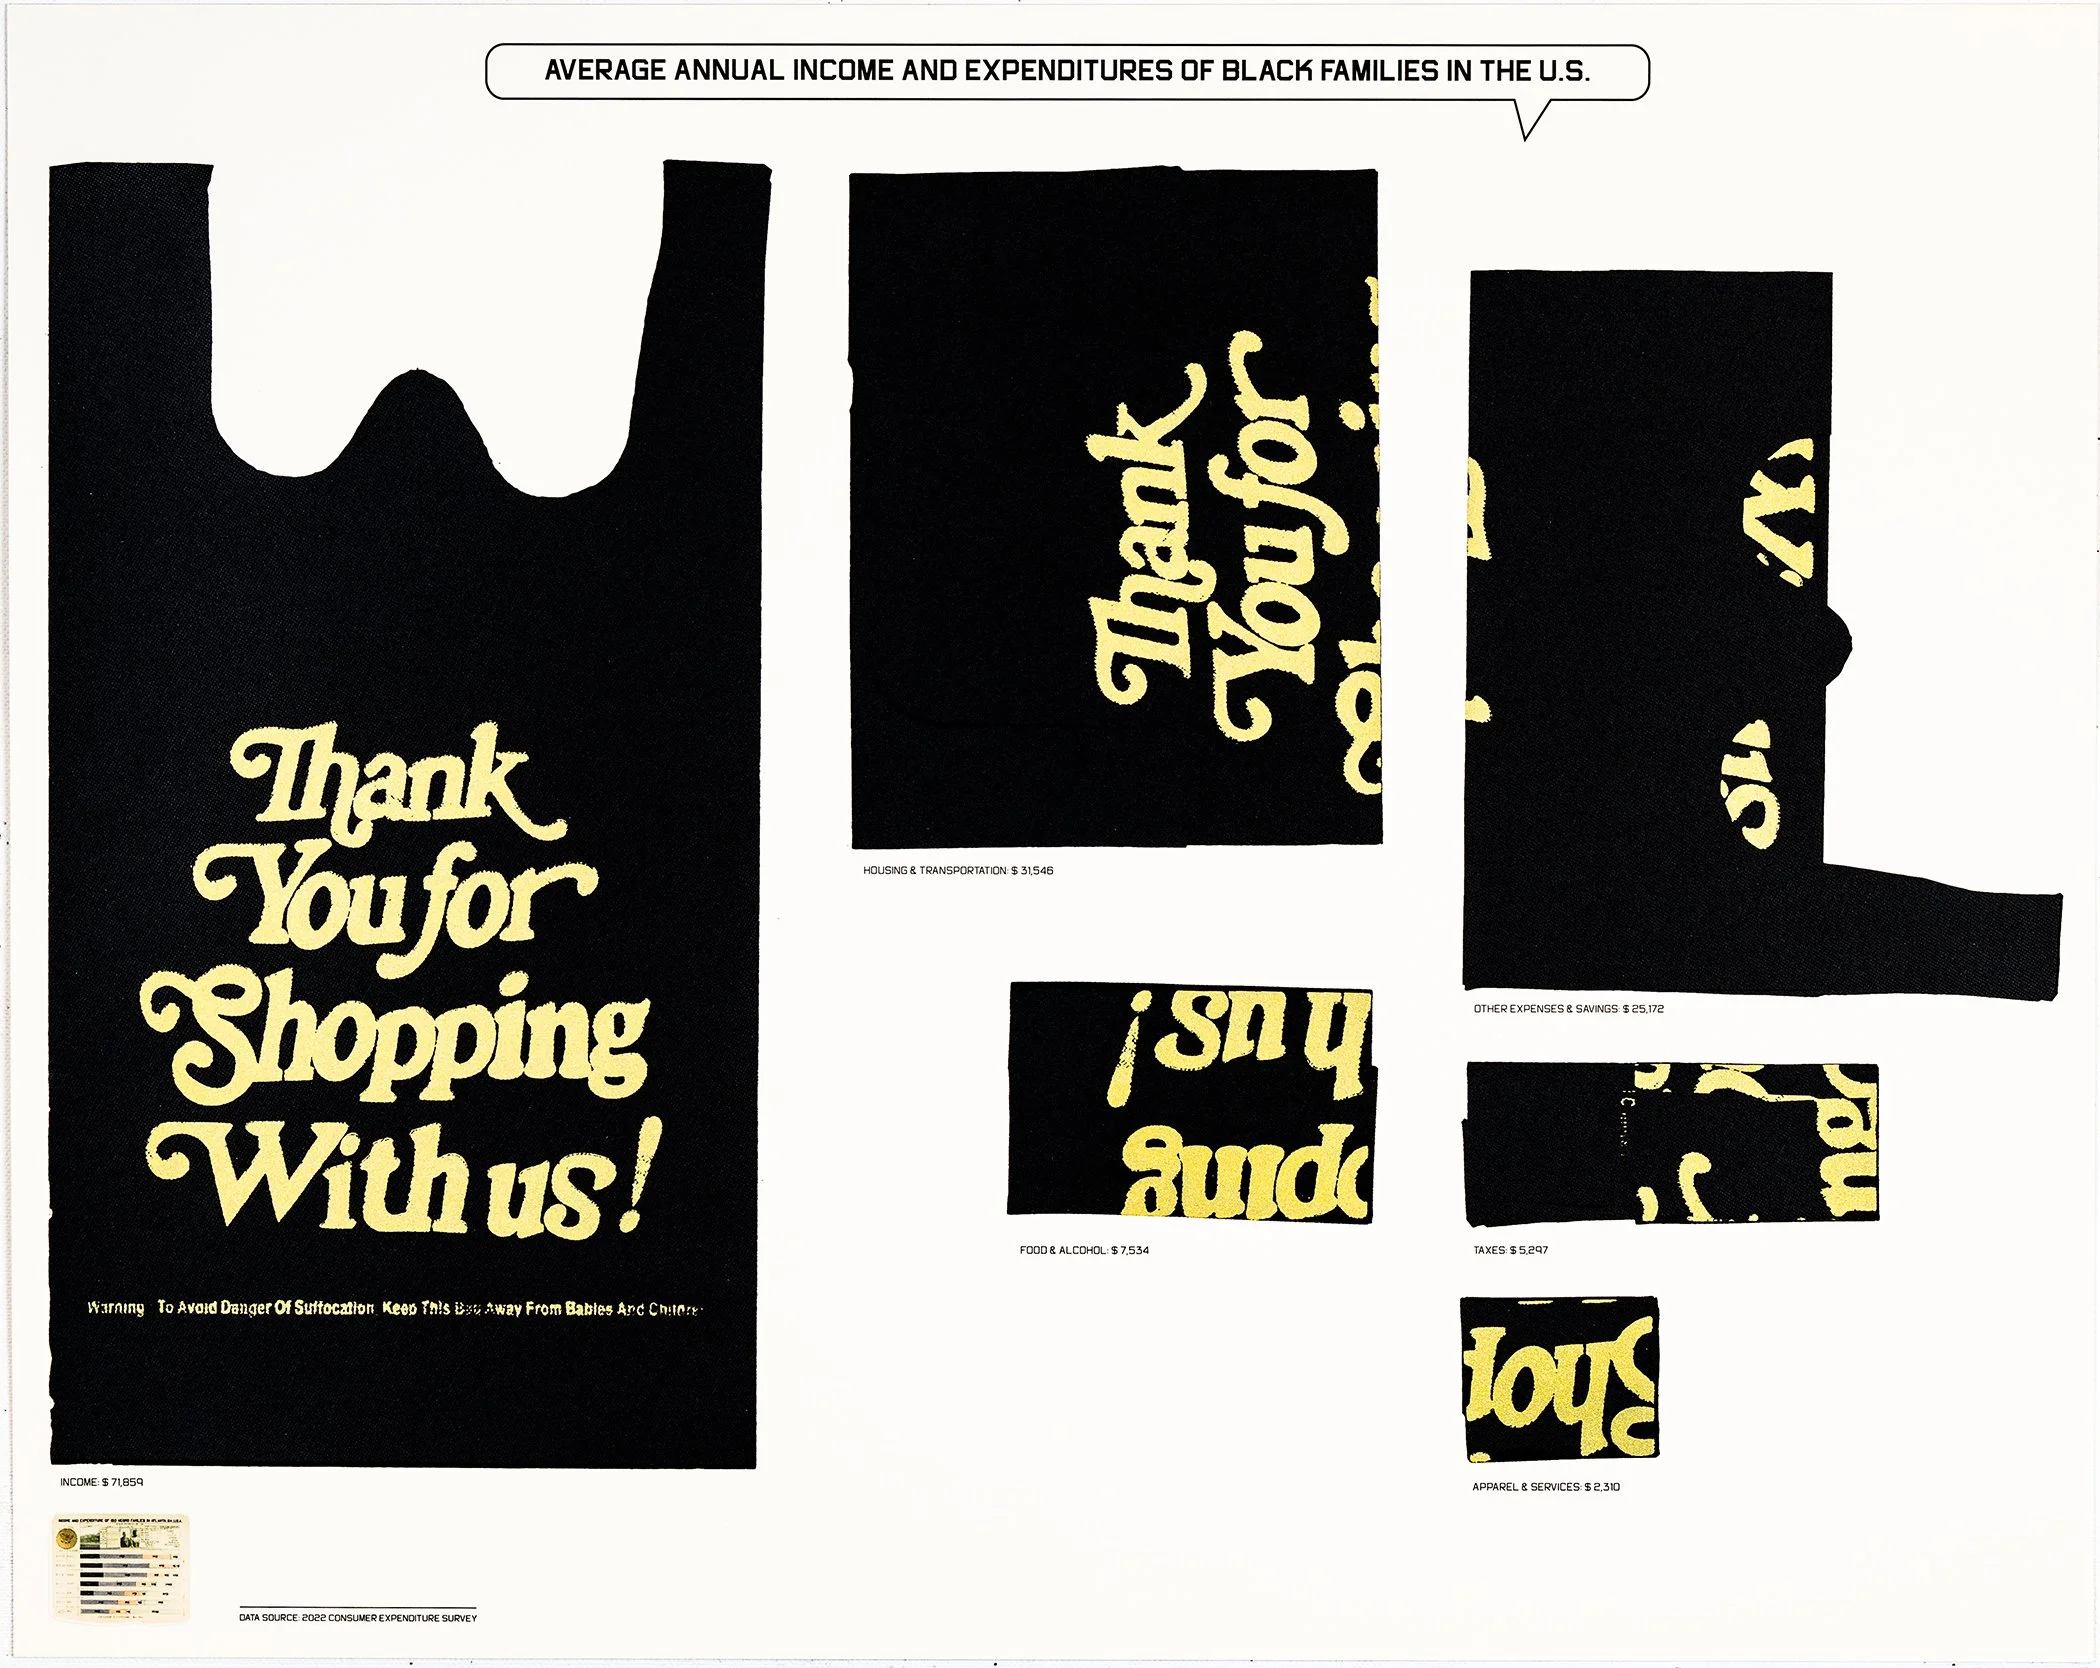
Average Annual Income and Expenditures of Black Families in the U.S. Screenprint, chine collé. 22 x 28. Printed and published by Island Press, Washington University, St. Louis, MO ©Villalongo Studio LLC. Courtesy William Villalongo, Shraddha Ramani and Island Press, St. Louis, MO.
AVERAGE ANNUAL INCOME AND EXPENDITURES OF BLACK FAMILIES IN THE U.S. | This infographic is an update of one of Du Bois’s most iconic data portraits which was illuminated by beautiful photographs of Black families and a gold “one dollar” coin. We decided to take a national average given that the data exists now. Without this data, Du Bois focused on Georgia using surveys taken door to door. As we look at the 21st century how Black families divide their income has changed along familiar lines. We see that housing is taking up the greater portion of their income and their is an increased investment in what Du Bois termed, “the higher life.” things such as savings, education and healthcare. As the plastic shopping bag comes to an end in many towns we celebrate the gold and black ones. A sign of financial means in many places, the humble plastic bag is an iconic part of history deserving its rightful as Pop Art.
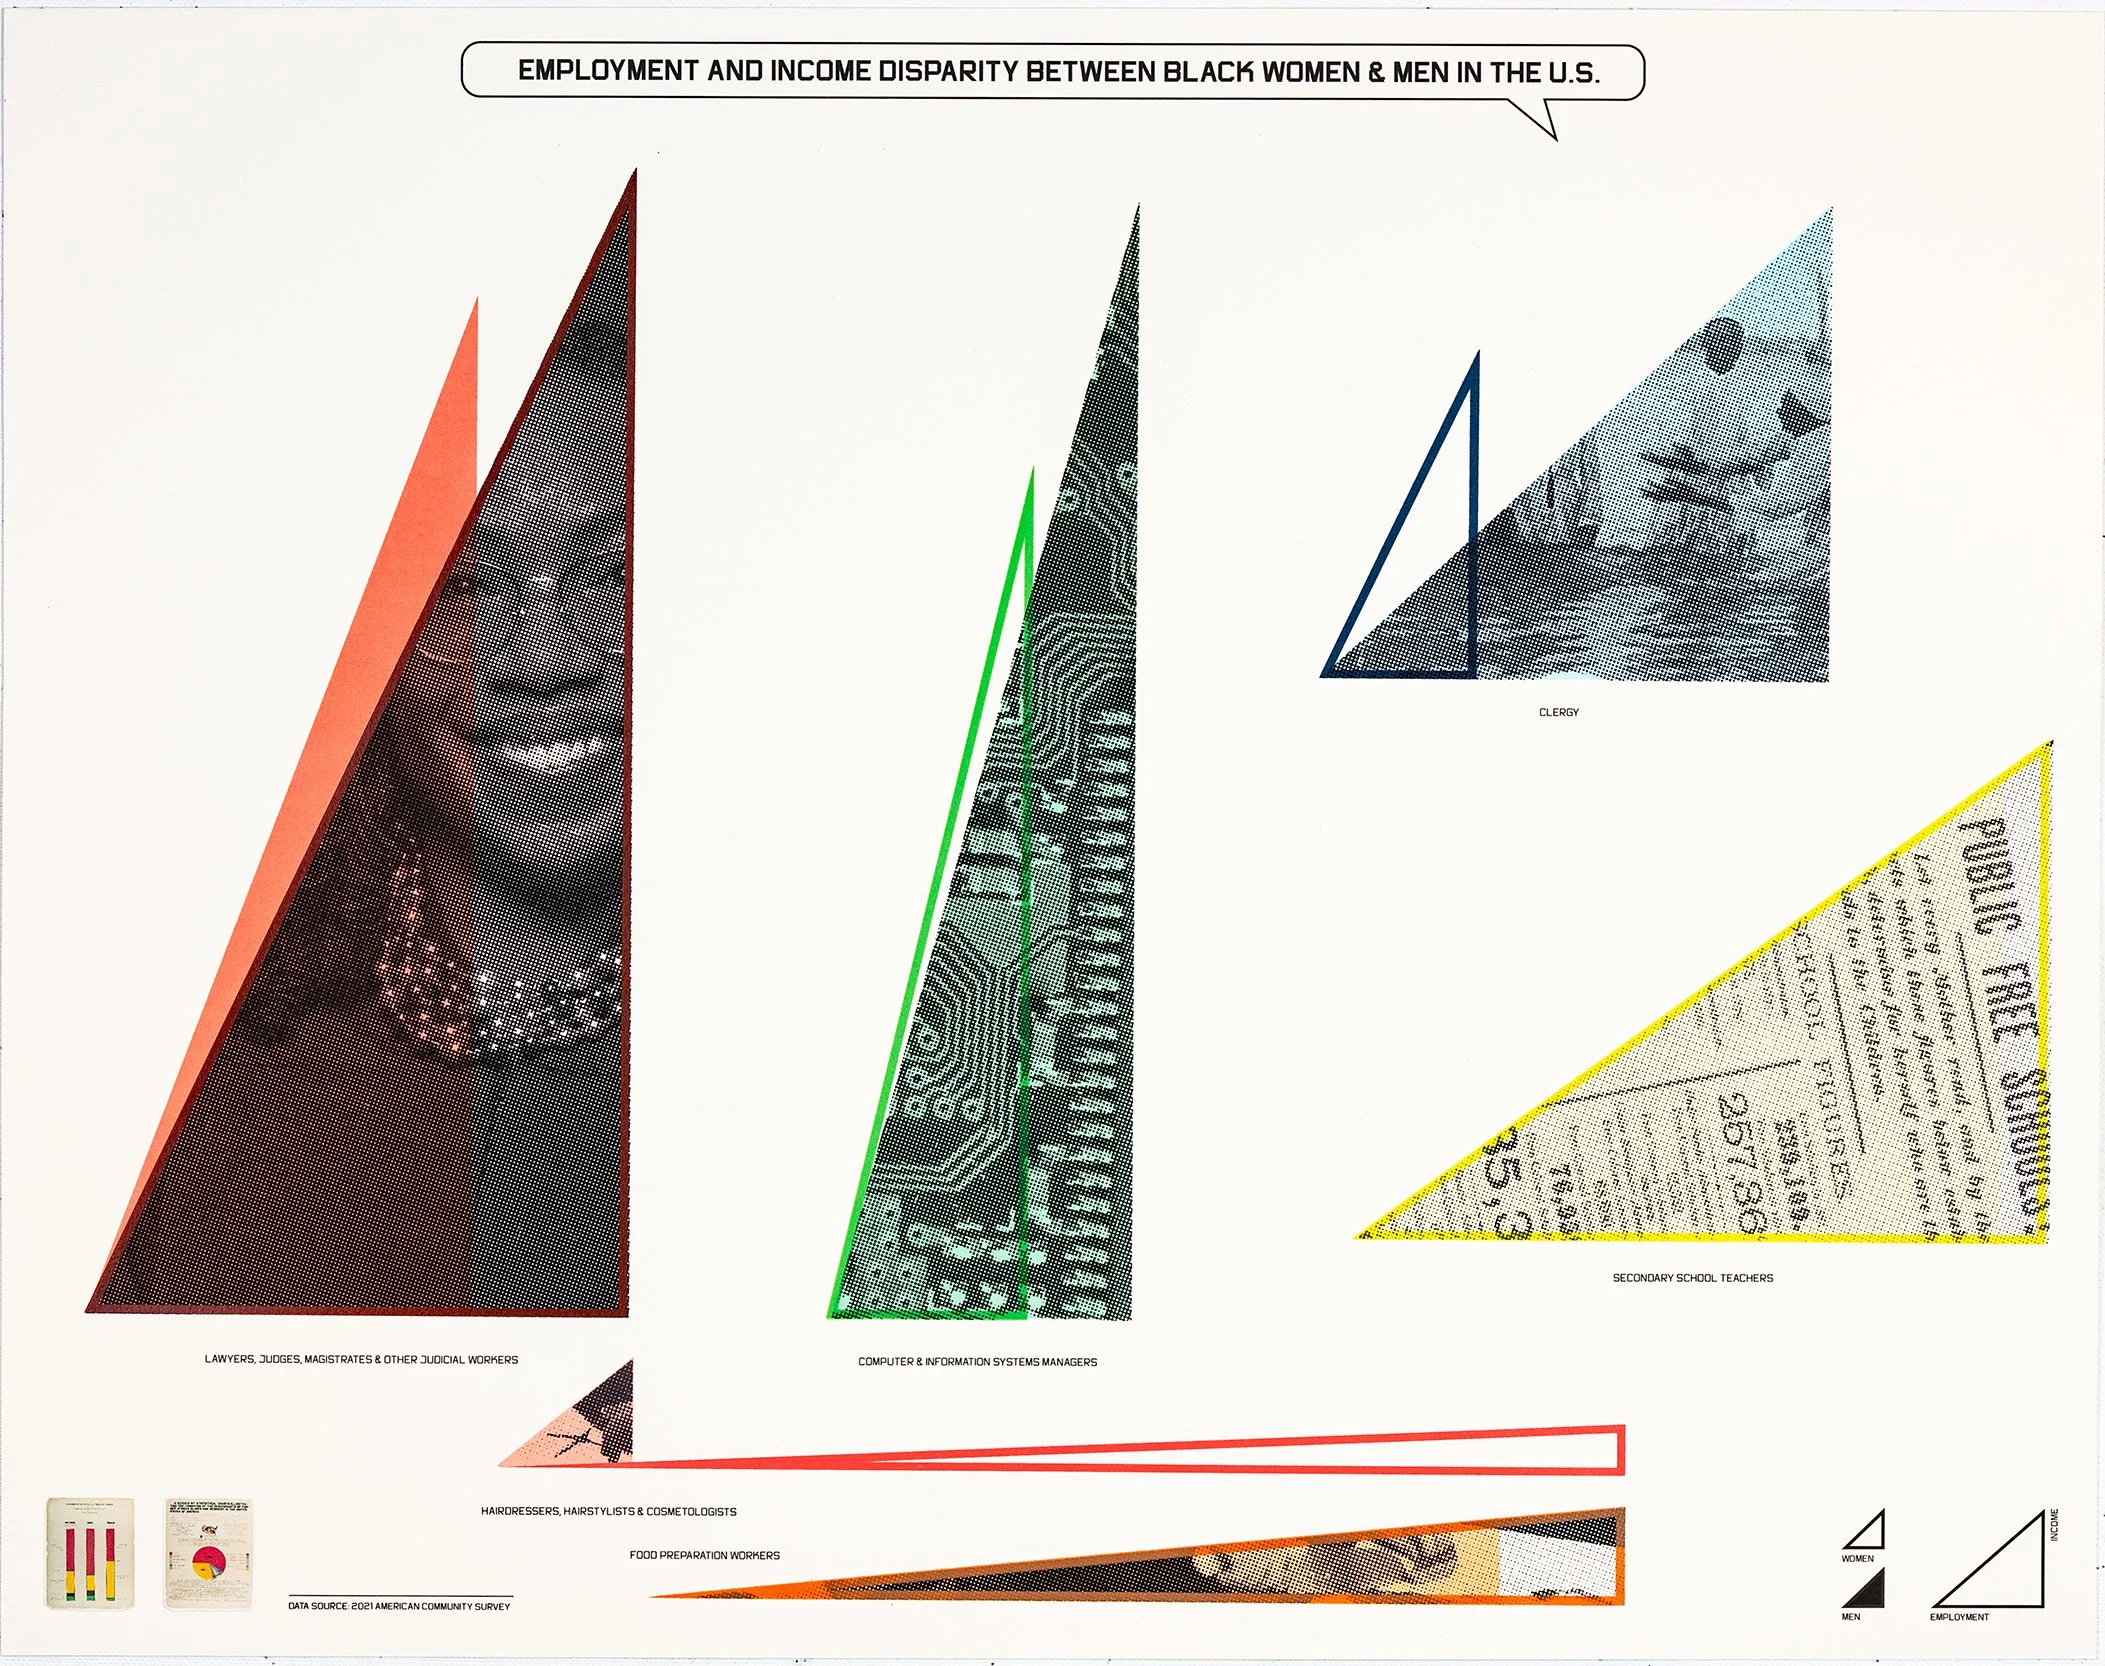
Employment and Income Disparity Between Black Women and Men in the U.S. Screenprint, chine collé. 22 x 28 inches. Printed and published by Island Press, Washington University, St. Louis, MO ©Villalongo Studio LLC. Courtesy William Villalongo, Shraddha Ramani and Island Press, St. Louis, MO.
EMPLOYMENT AND INCOME DISPARITY BETWEEN BLACK WOMEN AND MEN IN THE U.S. | The image shows the income to employment disparities in six professional fields. Since, 1900 there have been considerable strides in Black employment particularly in an expansion of possibilities for employment. However small in number Black people are working across the spectrum occupations. Even so, it is no surprise that Black unemployment remains relatively high to that of other races. Here we decided to focus on Black men and women for a more intimate story in the larger employment story using a series of triangles. The length of each base represents employment while the high of the triangles represent income. Women are represented by a colorful outline and men are represented by a colored fill. The photographic images do not represent data, yet illustrate each occupational category. When we compare these disparities between Black men and women we see interesting trends where one gender may outpace the other within a given field. Some of these are surprising such as the relatively small amount of men hairstylist compared to women make almost double the income or how women outpace men in income and employment in the field of layer, judges, magistrates and other judicial workers.

“Sites of Wounding/Sites of Healing” Alternative Atlas: STL. Screenprint. 28 x 22 in. Printed and published by Island Press, Washington University, St. Louis, MO ©Villalongo Studio LLC. Courtesy William Villalongo, Shraddha Ramani and Island Press, St. Louis, MO.
“SITES OF WOUNDING/SITES OF HEALING” ALTERNATIVE ATLAS: STL | We learned many things from scholars in STL and WashU, but the most amplified was the incredible impact of Walter Johnson’s book, The Broken Heart of America: St. Louis and the Violent History of the United States has had on how the city sees itself in various spheres from academia and cultural institutions to current political arguments. Johnson’s book arcs the founding, flourishing and decline of St. Louis as an industrial center of America. It reaches deeply into the geography of the city accounting atrocities and triumphs neighborhood by neighborhood and block to block. It explains how the ghosts of the past live in present STL making what was once a major destination for Black people during the Great Migration one of the most inhospitable places for Black people to exist in the U.S.
Walter Johnson at Harvard, Linda Samuels and Geoff Ward at WashU developed a cross discipline studio course called, “Alternative Atlas: STL” for WashU in which students mapped the sites in Johnson’s book connecting the current geography and architecture of the city to layers of the past. They labeled them as “sites of wounding” or “sites of healing” and later this data would be pulled into an interactive map which animates points, areas and streets on which these occurrences accumulate over time and space. We present their map as a still image which has all the layers present. Through the process of printmaking we recreate a dissipation effect of layers through translucency along the map’s timeline of events. We stayed true to their original color scheme which gives one the feeling of hovering over a city at night. While not every data point in “The Broken Heart of America” is connected to Black histories, their stories and the stories of others have impacted the present Black population of STL most acutely. Instead of listing every location our work encourages the viewer to see the city as a complex of emotion and a place to discover Johnson’s book or the Alternative Atlas course project.